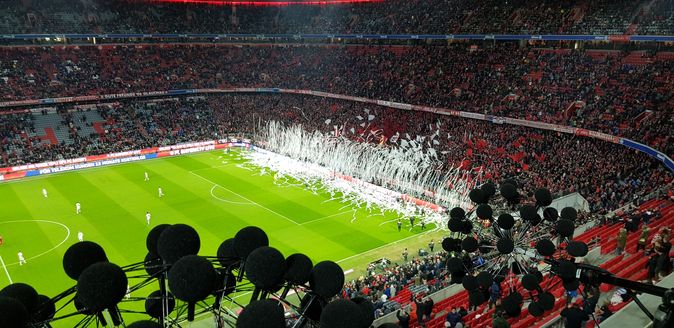
On the Internet, numerous rankings of the loudest fans and loudest stages can be found. While the volume in the stadium can be measured comparatively easily with a smartphone, measurement and analysis using beamforming are very complex. This is due to the fact that the Acoustic Camera captures every football fan as a single data point in a three-dimensional measurement! Our spherical microphone arrays have been developed especially for three-dimensional interior measurements. First, a 3D model is created as the basis for all measurements. This is followed by temporal, spatial and frequency-selective analyzes in conjunction with the acoustic data.
As an interesting fact, we conducted an acoustic measurement inside a stadium already in 2010. At the Michigan Stadium (American Football), we recorded the highest number of noise sources ever measured by beamforming (109,901 viewers = 109,901 individual sound sources). On our YouTube channel you can find a video showing this measurement. It needs to be mentioned that we only used the Acoustic Camera for a 4-minute half-time measurement. On the contrary, we have now recorded the fans in the Allianz Arena throughout the whole game. In the first step, our acoustics engineers used a laser scanner to capture the Allianz Arena in 3D. Subsequently, they created a 3D point cloud of the stadium based on the scan data. After the acoustic measurement, the acoustic hotspots in the stadium were mapped on the 3D model.
During the game against the TSG 1899 Hoffenheim, the acoustic data of 75000 fans was recorded. For this purpose, two Sphere Arrays served for the data acquisition of the crowd noise during the entire game. Secondly, the acoustic data was used to create an acoustic video by mapping the sound sources to the 3D model of the stadium.
As a result, the evaluation results of the Acoustic Camera serve further data visualization and statistical analyzes. While the sound source mapping in beamforming is classically represented as color gradients, for so-called "data scientists" every fan sound is a single data point. These data points are the basis for pattern recognition and correlation analysis, which are performed throughout all measurements in the season. From "Where in the stadium are the fans the loudest" to "In what weather are the fans quieter?" To "Which teams have louder fans than others?" Many questions are possible. After that, predictions about the behavior of the fans and the influence of the chanting on the game score are the next step.


