The Acoustic Camera as Solution for a Full-Vehicle NVH Analysis in an Aircraft

Measurements in the Aircraft Interior

A company responsible for the interior design of a business jet discovered an annoying sound in their new top-class business airplanes during steady flight. Business jets have a high standard of quality and the sound impacts experienced during a flight should be kept at a minimale, comfortable level. To address the acoustic insulation during the next maintenance cycle of the aircraft, the major sound sources during the flight needed to be identified. For this purpose, an NVH measurement (Noise Vibration Harshness) with the Acoustic Camera was used.

Measurements

Measurement Object

Bombardier BD-700 - 1A10 Global Express

Measurement Set-up

The spherical array was set-up in three different positions, in front, in the middle and in the end of the passenger cabin. The data recorder and the mobile power supply were placed between two groups of seats. The set-up of the system took less than 20 minutes.

As basis of the three-dimensional analysis, a 3D model of the cabin was created using a Faro Scanner (see Fig. 3). Due the lengthened shape of the aircraft, three scanner positions where measured and fitted together into one 3D model. After the measurements the 3D-model was imported to NoiseImage and fitted via a special, patented algorithm. For the analysis the acoustic data was mapped onto the 3D model.

System Characteristics

Microphone array Sphere48 AC Pro

  • 48 microphones
  • 35 cm diameter
  • Acoustic mapping range: 12 dB -130 dB
  • Recommended mapping frequencies: 291 Hz - 20 kHz
  • Dynamic range: 9 dB - 14 dB, up to 50 dB with Advanced Algorithms
  • Typical measurement distance: > 0.3 m

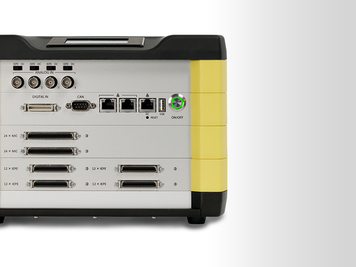
Data recorder mcdRec

  • 192 kHz Sampling frequency
  • up to 168 time-synchronized, analog channels (7 cards with 24 channels each)
  • Ethernet Interface > high transfer rate > 20 MByte/s, network-compatible
  • Digital card with 12 extra channels for recordings of RPM, rotation angle,  reversal point, etc.
  • Integrated PC with Windows XP (embedded)

Software NoiseImage

Power supply

  • Mobile power supply / battery pack

Results

During the flight, only stationary noises occured. The sound pressure levels (SPL) showed a significant increase of 2 dB in the front and the middle sections of the cabin.  After applying an A-weighting filter, the difference did not seem to be as significant (less than 1 dBA). The major emissions could be located in the middle of the passenger cabin, above 630 Hz.

The acoustic data was analyzed in the frequency domain and in the time domain.

Results in the Frequency Domain

The origin of the noise was found in different third octave bands of 250 Hz, 315 Hz, 3150 Hz and 6300 Hz. The sound was radiating from the floor in the middle of the cabin and from the side of the fuselage.

Time Domain Results for the front and the back measurement positions

These Figures visualize the results from two different array positions. The loudest sound sources were located at the ceiling above the chosen measurement position, 85.22 dB (front) and 83.06 (back) dB. In both scenarios, ground-reflected sources, around 68 dB, can also be seen.